| 1 |
Nigeria |
~$390 |
Crude oil & natural gas |
| 2 |
Egypt |
~$385 |
Tourism, Suez Canal, remittances, natural gas |
| 3 |
South Africa |
~$380 |
Mining (gold, platinum, diamonds), manufacturing, finance |
| 4 |
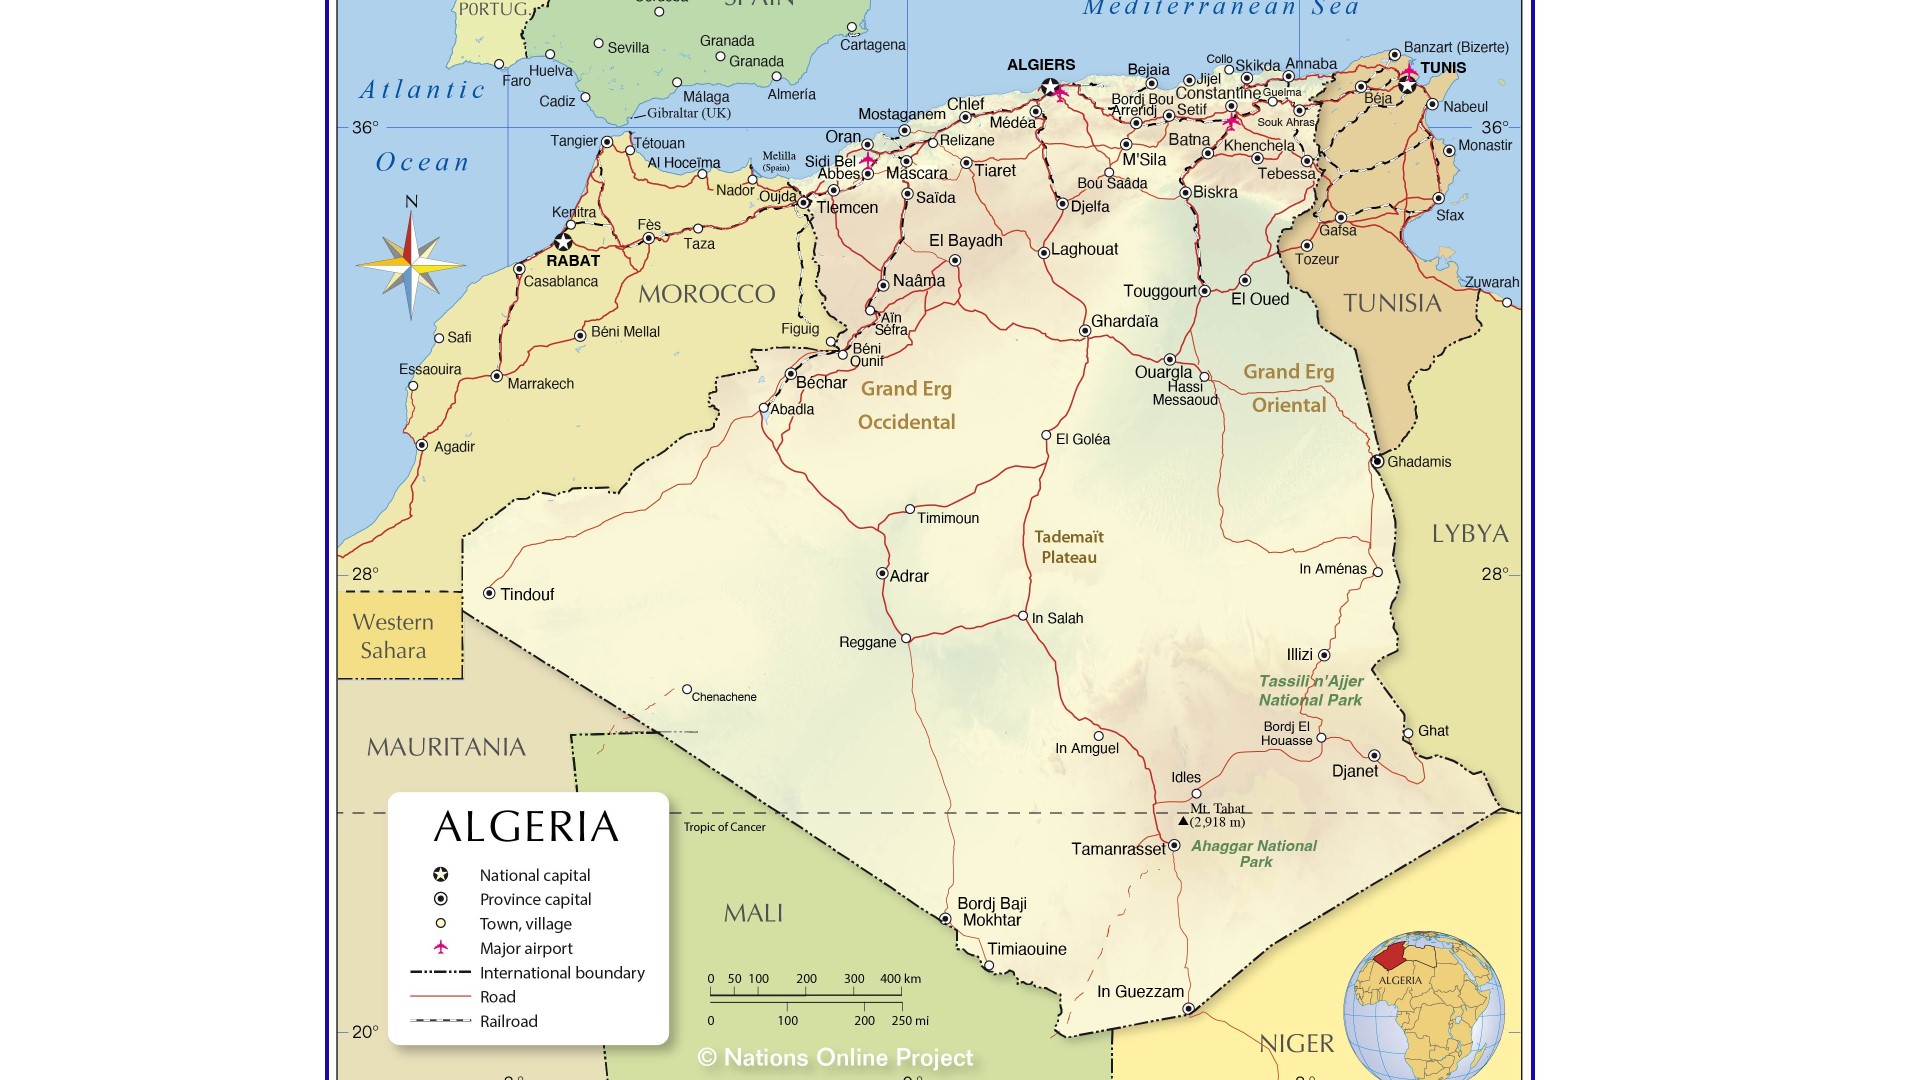
Algeria |
~$240 |
Oil & natural gas |
| 5 |
Ethiopia |
~$205 |
Agriculture (coffee, oilseeds), light manufacturing, services |
| 6 |
Morocco |
~$152 |
Agriculture (phosphates), tourism, automotive manufacturing |
| 7 |
Kenya |
~$115 |
Agriculture (tea, horticulture), services, technology |
| 8 |
Angola |
~$107 |
Crude oil & diamonds |
| 9 |
Tanzania |
~$85 |
Gold, agriculture, natural gas |
| 10 |
Ghana |
~$76 |
Gold, cocoa, oil |
| 11 |
Côte d’Ivoire |
~$79 |
Cocoa, cashews, petroleum products |
| 12 |
DR Congo |
~$68 |
Mining (cobalt, copper), oil |
| 13 |
Uganda |
~$52 |
Oil (developing sector), agriculture (coffee), remittances |
| 14 |
Tunisia |
~$51 |
Tourism, olive oil, phosphates |
| 15 |
Cameroon |
~$49 |
Oil, agriculture, timber |
| 16 |
Libya |
~$45* |
Oil & gas (volatile due to conflict) |
| 17 |
Zambia |
~$30 |
Copper, agriculture |
| 18 |
Senegal |
~$30 |
Gold, phosphates, tourism, services |
| 19 |
Zimbabwe |
~$33 |
Gold, agriculture (tobacco), platinum |
| 20 |
Sudan |
~$32* |
Gold, oil (pre-secession), agriculture (volatile) |
| 21 |
Guinea |
~$24 |
Mining (bauxite, gold) |
| 22 |
Mali |
~$23 |
Gold, cotton |
| 23 |
Burkina Faso |
~$21 |
Gold, cotton |
| 24 |
Benin |
~$19 |
Cotton, port services, agriculture |
| 25 |
Rwanda |
~$14 |
Services, tourism, tea & coffee |
| 26 |
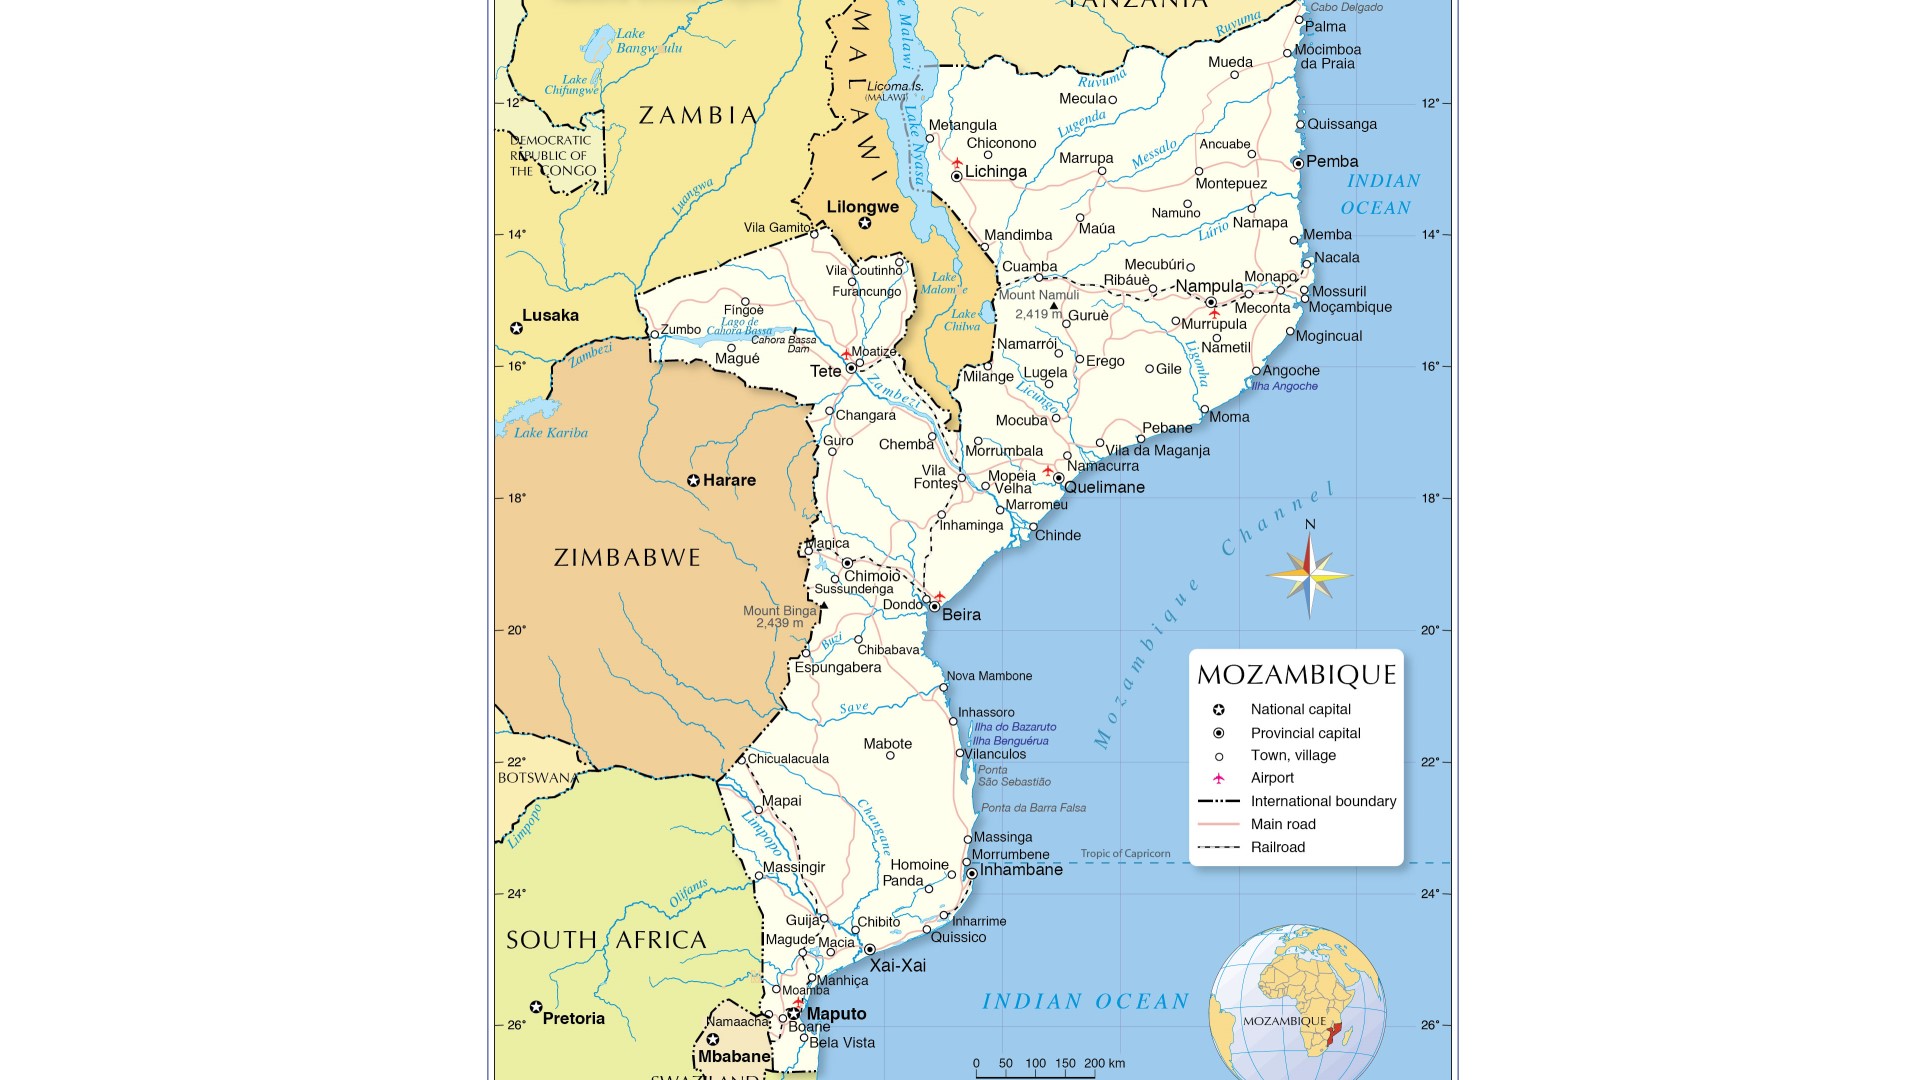
Mozambique |
~$21 |
Natural gas (LNG), coal, aluminum |
| 27 |
Niger |
~$19 |
Uranium, oil (recent expansion) |
| 28 |
Malawi |
~$13 |
Agriculture (tobacco, tea, sugar) |
| 29 |
Chad |
~$13 |
Oil, agriculture |
| 30 |
Madagascar |
~$16 |
Vanilla, mining, tourism |
| 31 |
Mauritius |
~$15 |
Financial services, tourism, textiles |
| 32 |
Namibia |
~$13 |
Mining (uranium, diamonds), fishing |
| 33 |
Botswana |
~$21 |
Diamonds, beef, tourism |
| 34 |
Mauritania |
~$11 |
Iron ore, gold, fishing |
| 35 |
Somalia |
~$11* |
Livestock, remittances, telecommunications |
| 36 |
Congo, Republic |
~$17 |
Oil, forestry |
| 37 |
South Sudan |
~$6* |
Oil (infrastructure challenges) |
| 38 |
Togo |
~$9 |
Phosphate mining, port services, agriculture |
| 39 |
Sierra Leone |
~$4 |
Iron ore, diamonds, gold |
| 40 |
Eritrea |
~$3* |
Mining, agriculture, ports |
| 41 |
Liberia |
~$4 |
Iron ore, rubber, shipping registry |
| 42 |
Central African Republic |
~$3 |
Gold, diamonds, timber |
| 43 |
Lesotho |
~$2 |
Textiles, water exports to South Africa, diamonds |
| 44 |
Burundi |
~$3 |
Agriculture (coffee, tea), mining (nickel) |
| 45 |
Eswatini |
~$4 |
Sugar, forestry, manufacturing |
| 46 |
Cabo Verde |
~$3 |
Tourism, remittances, services |
| 47 |
The Gambia |
~$2 |
Tourism, peanuts, remittances |
| 48 |
Guinea-Bissau |
~$2 |
Cashews, fishing |
| 49 |
Comoros |
~$1 |
Vanilla, cloves, tourism |
| 50 |
Seychelles |
~$2 |
Tourism, tuna fishing |
| 51 |
São Tomé and Príncipe |
~$0.7 |
Cocoa, tourism |
| 52 |
Djibouti |
~$4 |
Port services, logistics, military bases |